
RITA℠ ALERTS, NEWS, AND INSIGHTS
Within the Financial Services Marketplace, The Best Help for Individual Investors Is Often Self-Help.
Rita℠ provides you investment-related information previously only available to professionals to individual investors. This information can help you to protect yourself from "Marketplace Risk" and to make sound investment decisions.
Should I Always Pick the Highest Ranked Choice?
Not necessarily. Although achieving the #1 ranked position certainly makes that mutual fund or ETF one to seriously consider, there are good reasons why you might decide to pick another, lower ranked mutual fund or ETF, in place of or in addition to the #1 ranked fund.
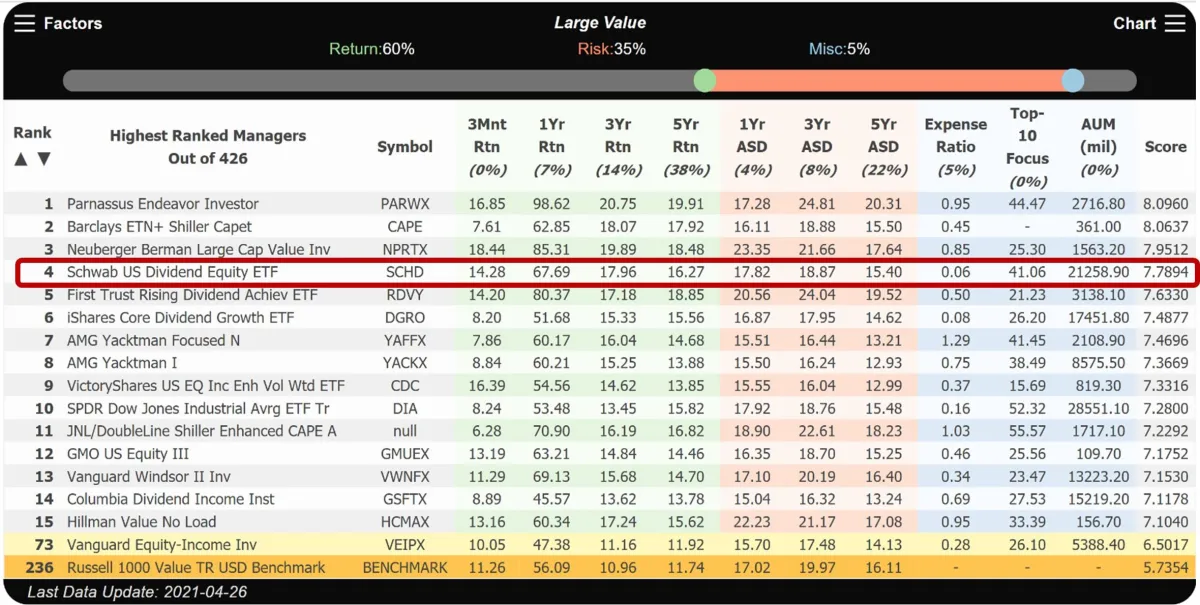
Here’s an example of a decision made to go with a lower ranked fund. It’s from a meeting with the trustees of a 401(k), in the 2nd quarter of 2021, where the technology was used to review the relative performance of the choices within their plan. This is the same process you would use to review the relative performance of the mutual funds and EFTs you own.
Case Study: Since this was the first fund that they comparatively evaluated, the trustees spent a considerable amount of time discussing various performance factors, factor weightings, and their significance. To understand the relative effects of changes in the weightings, they experimentally changed them. In doing so, they saw that the composite performance of the top 5 were so strong that, even with significant changes in the degree of emphasis applied to return-related and risk-related factors, each stayed in the top 5 (although their ranking order shifted). This phenomenon was further illustrated when the funds’ numerical scores were plotted against their numerical ranks, shown in the Chart below. The vast majority of the 426 choices appeared to lay along what we refer to as “the slope of mediocrity.” One can go to any number of choices along that slope without generating an appreciably different composite score. However, at around the choice ranked #5, the slope dramatically changes, indicating funds with significantly better composite performance. It was also pointed out that this is one of the reasons why it is so difficult for investors (and their advisors) to pick truly superior mutual funds. Without a technology like this with which to identify them, the “odds” that they can be successfully identified are quite low.
Ultimately, the trustees settled on a 60% / 35% / 5% weighting of Return, Risk and Miscellaneous related factors and decided that #4 appeared to offer the blend of factors that they felt best matched their 401(k) plan’s participants’ likely preferences. Although it did not have the highest returns, #4 substantially outperformed their current choice, with only slightly more volatility (but still less than the Index), and at less cost.

Below is the Chart, mentioned above, in which the Score is plotted against the Rank. If you click on “Chart” at the top right of the table, RITASM will create this Chart for you, in each of your analyses. It is often helpful to see the distribution of the total number of choices displayed in this way.

But, what about #1 . . . it looks very strong? Yes, it does and, in a circumstance like this, you (as an individual investor) could select #1 in addition to #4 in whatever relative percentage proportions you decide. For example, looking up at the table, #1’s returns were quite a bit higher than #4’s, but so was its volatility (i.e., Risk), and its cost was a good bit more. It was the relatively higher risk-related numbers that caused the trustees to select #4. But you are not selecting for others, like they were. So, you could (we’re not saying “should”) legitimately consider putting 80% of your funds in this asset class in #4 and 20% in #1, in order to boost the upside return potential of the asset class. We have seen “split decisions” like this quite commonly done.
So, when using RITASM it’s always useful to look at the other choices within the top 10 – 15 to see if one or more of them is attractive to you because of a different blend of performance and whether one or more of them, separately or together, might best meet your needs.

“I would highly encourage and recommend that average investors take a look at this great technology . . . I’ve never seen anything like it."
Joe H.

“As a friend of the creators of Rita, I’ve watched this game-changing technology evolve over many years to a point where I can say, yet again, “you have to see it to believe it.”
Mark L.
"RITA is the greatest decision assistance technological invention of our time. This will change the way we invest forever."
Kay K.
Why Rita℠?
Worried about picking the right mutual funds and ETFs for your investment portfolio or your IRA or 401(k)? Rita℠ is the solution. Rita℠ is the only Retail Investment Tracking Application℠ that quickly and easily answers this key question: "Of all the available choices of mutual funds and ETFs, which ones are best for me? With Rita℠, you can feel confident that you're picking the best mutual fund and choices for your future. Stop guessing what's best for you - let Rita℠ do all the hard work!

“I've witnessed first-hand dozens of demonstrations of "RITA" to friends I’ve introduced. What's remarkable is when a person sees how much money he or she has not gotten over multiple years, they’re shocked. It shows them how much better they could be doing with this revolutionary investment tool.”
Robert S.
“This technology a game changer for individual investors. . . a major breakthrough. Investors will now be able to see how much money they’re leaving on the table, and the information obtained from Rita is actionable.”
Albert M.

Any investing-related information provided on sayrita.com is for educational purposes only. Decision Technologies Corporation does not offer investment advisory or brokerage services, nor does it recommend or advise investors to buy or sell particular mutual funds, ETFs, or other investments.
<a rel="me" href="https://mastodon.social/@sayrita">Mastodon</a>
© Copyright 2025. Rita℠ by Decision Technologies Corporation. All rights reserved